Introduction
Being able to track produce back to the field regarding food security and quality, does not only support buyers and processors, it also helps farmers to identify problems and improve their yields in the following years. This use case opens data flows between stakeholders in the supply chain as an important step towards smart digital farming. The information and caliber measurments are gathered throughout the entire season through sensors mounted onto machinery, in addition to soil mapping performed by drones or satellites. Leveraging it enables potato processing companies to optimise logistics to ensure the continuous quality of their activities. Besides the technological components applied, this use case also addresses the growing demand for traceability among consumers in terms of food safety as well as quality.
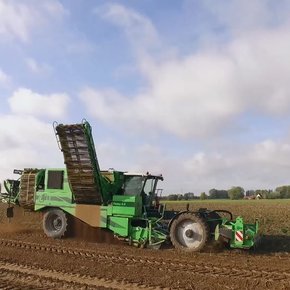
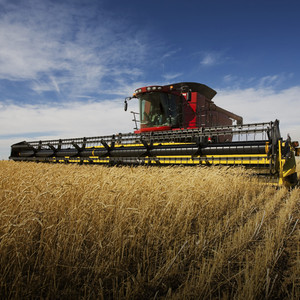
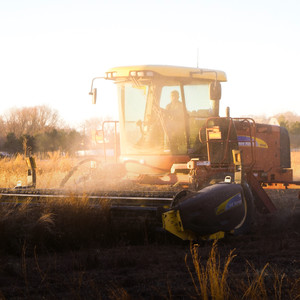
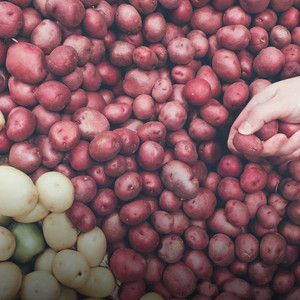
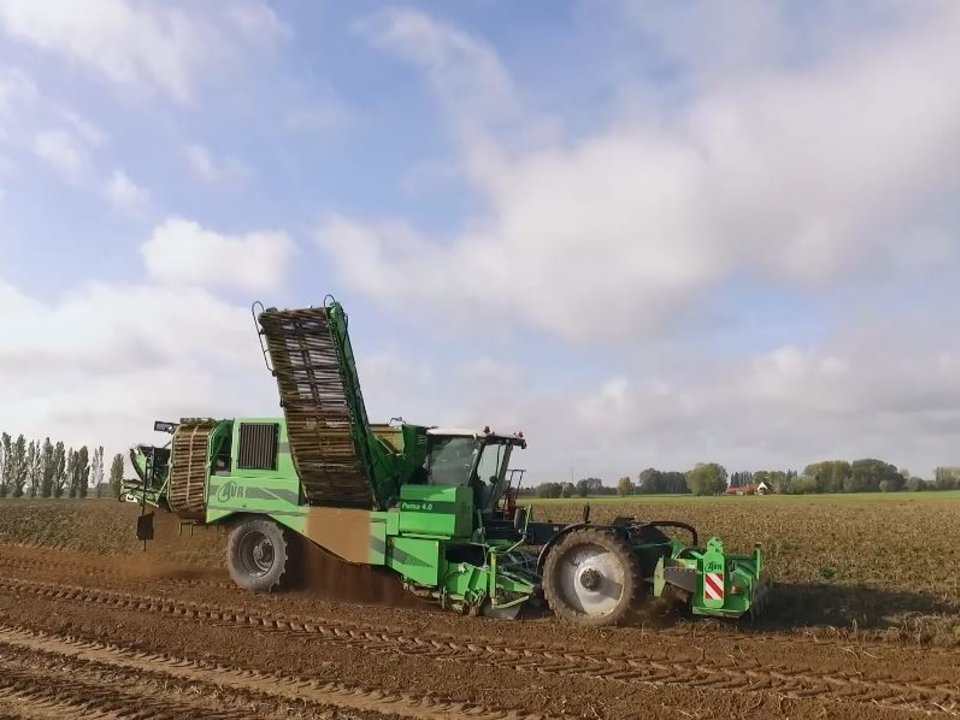
A busy harvesting day
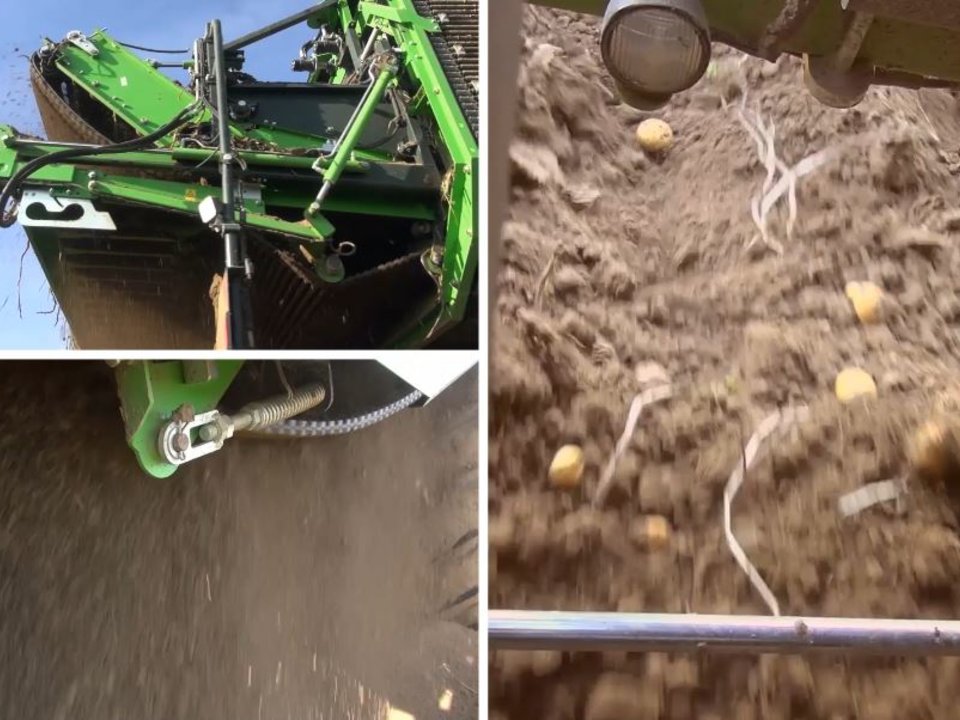
We visited this use case at one of their testing sites in Belgium during the busy harvesting season. The AVR Puma 4.0 four-row potato harvester and a fully loaded trailer pulled by a tractor were just returning from the field with the last harvested potatoes.
Show more
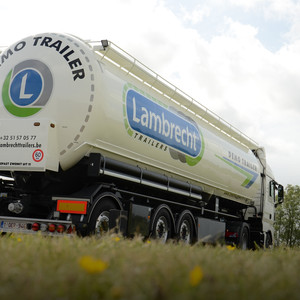
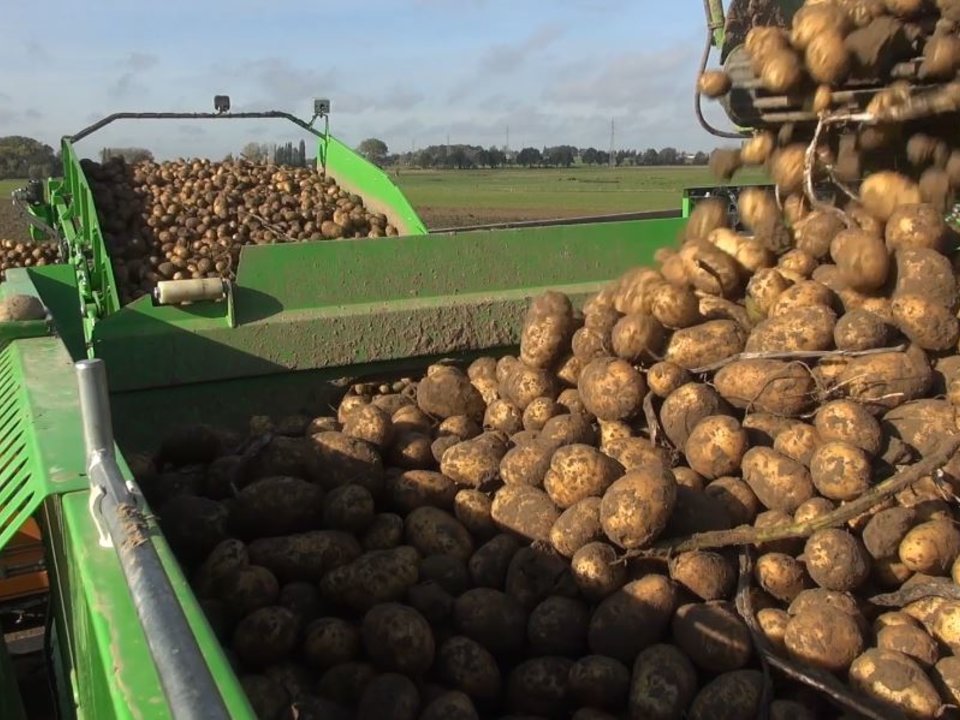
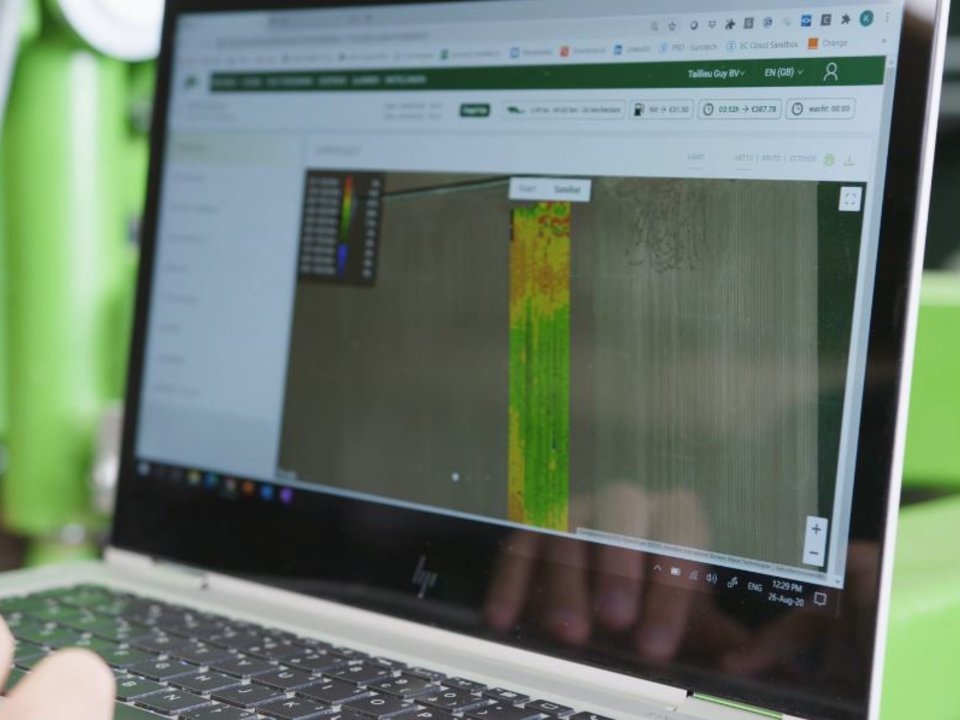
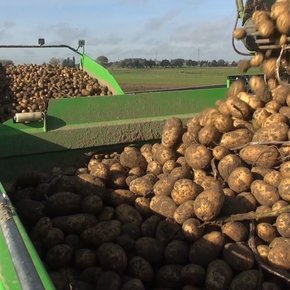
Both agricultural machines are equipped with precision GPS and radio-frequency identification (RFID) readers to know exactly from which part of the field each load is coming from. This traceability feature is important for future reference as the potatoes end up in wooden crates at the processing plant after weighing. The yield data of the harvest is collected and displayed on a detailed map to give the farmer an in-depth insight into the efficiency of his field. In addition, the map can also identify the field’s more and less productive zones. The underlying cause can then be determined so the farmer can take action to optimise the yield across the entire surface area. Next to the Belgium testbed, Koen Uyttenhove, the Use Case Coordinator, and his team also employ similar testing sites in the Netherlands and Poland.
+25%
Yield prediction accuracy
-50%
Yield sampling costs
With standardised sensor systems in every vehicle and the cost of IoT technology falling, the use case team connects the sensors to gather detailed insights into environmental conditions, crop yield and field management. Together with Delaware the researchers developed a MS Azure-based digital platform that visualises all measurements and functionalities to help the farmers face the challenges of modern agriculture AVR by incorporating a set of IoT building blocks. Farmers can use this data to improve their monitoring approaches and crop processors get insights into the quality and characteristics of incoming produce. These real-time, accurate insights lead to higher efficiency, less waste and better processes. The web connectivity indicates that sensors positioned in various locations on the harvester collect data from the field and send them to the personal user platform AVR Connect through the cloud. The platform can visualise a variety of data including trips management, harvest duration, geofencing, integrated yield measurement as well as a real-time overview of all settings and parameters. Some machine settings can also be linked with quality reports when delivering a load of potatoes. Moreover, the platform can also accommodate other applications and combines this data as well so that they reinforce each other. This makes it an open platform able to share data with other packages through application programming interfaces (APIs). Data exchange standards, however, are still an obstacle at the moment. Registering a variety of machine data through one platform will provide the end-user, processor as well as consumers with a wealth of information on all conditions from farm to fork in the future.
Meeting changing consumer demands
Market surveys indicate that the consumer profile is undergoing radical changes and a much more critical consumer is emerging. The categories are shifting from age-related groups that make dietary choices based on family circumstances to groups that make their selection on the basis of individual behaviour and quality demands.
Show more
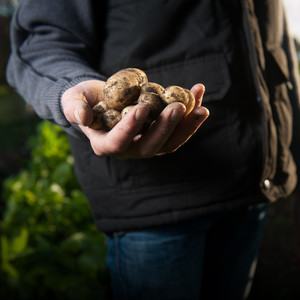
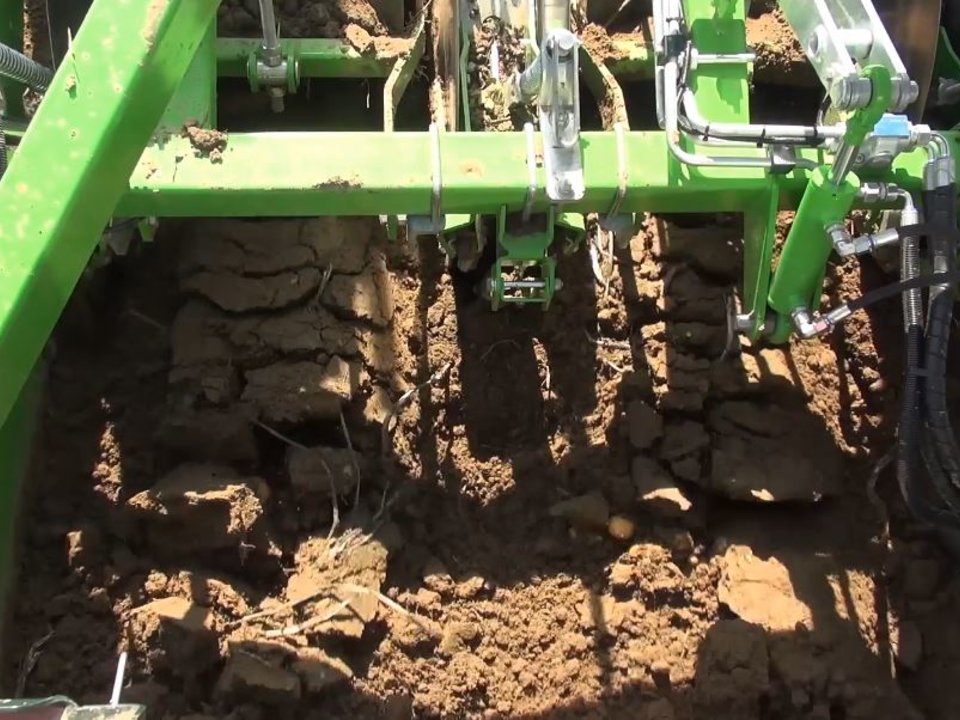
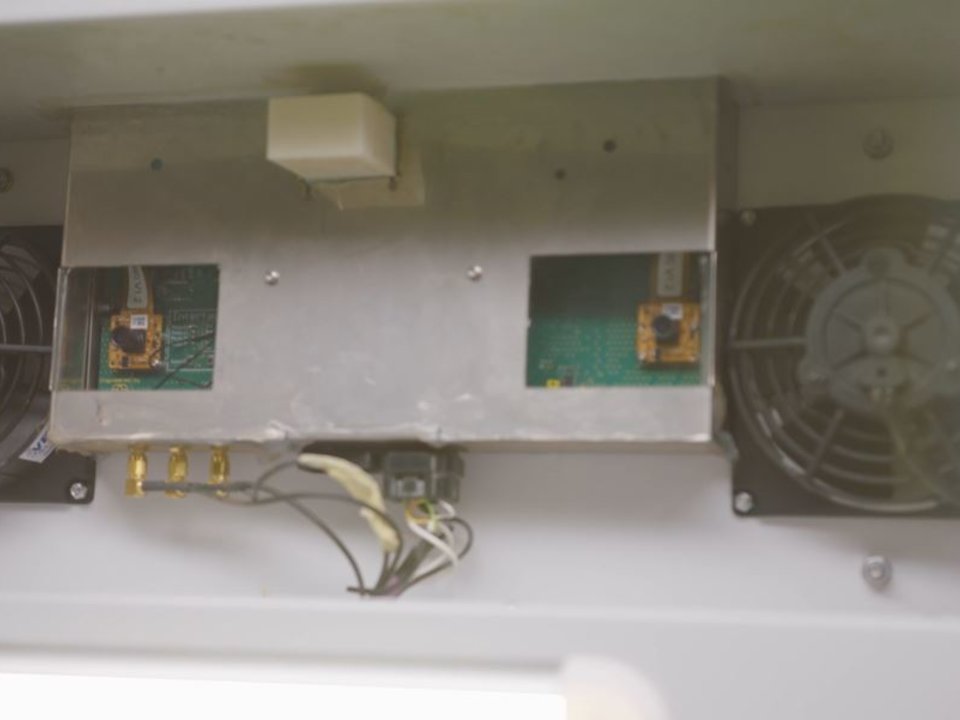
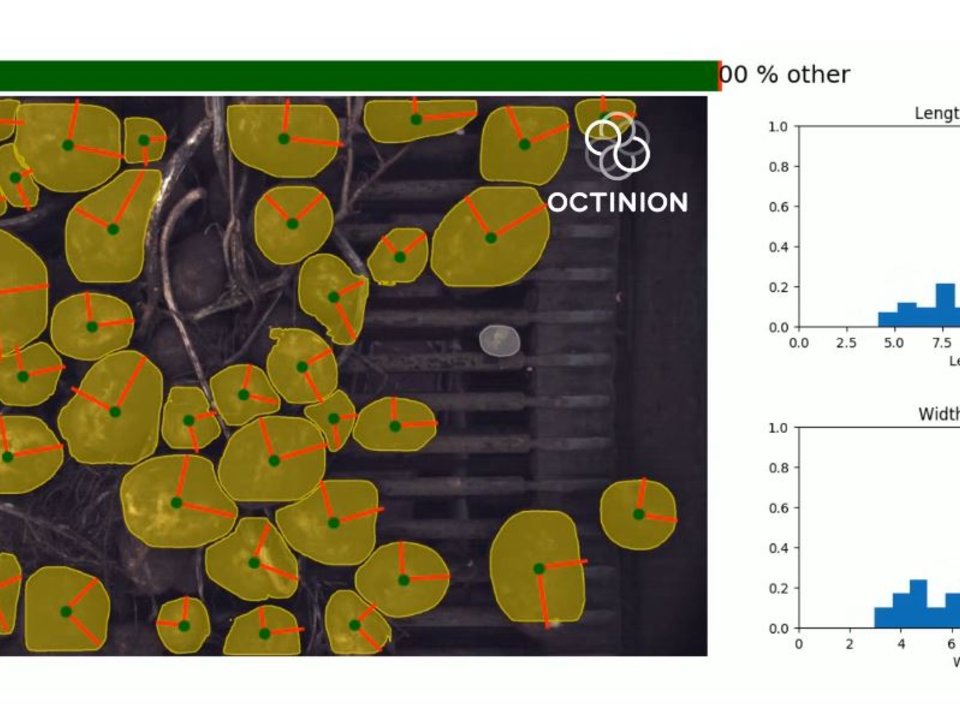
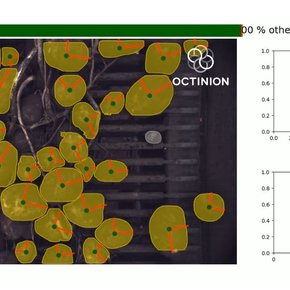
To respond to this paradigm shift, the use case together with Octinion designed a prototype of the caliber measurement system which is composed of two RGB cameras mounted on a customised printed circuit board (PCB). PCB. A PCB connects all electronic components to form a working circuit or assembly. In this case, the board couples all three aspects of the measurement system (image acquisition, image processing using a deep neural network and communication to AVR controllers) in a very compact module. With the help of algorithms the caliber measurement system determines the size and width ratio of the harvested potatoes. It furthermore gives accurate insights on the amount of soil which is a by-product since the potatoes are taken out of the ground at 30 to 40 cm depths. The amount of soil varies greatly depending on the weather and humidity. If the soil is very wet the amount of soil sticking to the potatoes can make up 30% of the entire truck load. The measurement system of the harvested is protected by a metal housing. The entire unit can be completely de-coupled from the green adaptor piece to enable the low-cost transfer and use on other harvesters with similar conveyor belt widths. To improve the accuracy of the potato measurement in the conveyer belt tunnel the use case team had to get the interference with airborne dust under control which is mostly a problem when the soil is very dry at the harvesting time. During operation, the images gathered by the dual camera system are processed in real time using a deep neural network. This network outputs a per-pixel classification for the classes 'potato’, ‘other’ and ‘background’ which is used for tare weight evaluation. An additional output of the network are the width and height for every potato that is completely visible in the camera field of view. After post-processing using the setup and camera geometry, this results in width and height measurements in milimeters. All the measurements are transferred via a communication protocol that enables the integration into the AVR Connect platform. To improve the results of the system the gathered images were reviewed by a human operator and added to the training model. This approach already resulted in considerable improvements to the system performance and enables the system to improve even further over time. Unsurprisingly, an accurate yield measurement system is of great importance for the farmers as well as the processors. Another aspect is important for the latter: the size. This is because certain consumer products such as fries require a certain potato size.
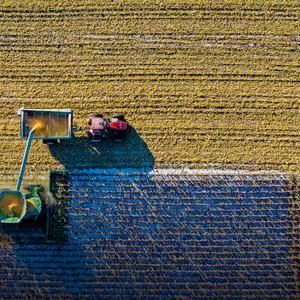
drone-based yield prediction
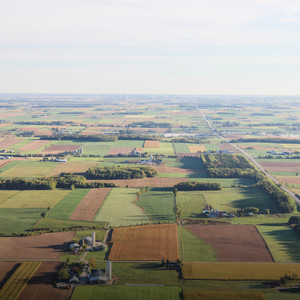
In collaboration with Aurea Imaging the use case explored the possibility of yield prediction based on drone data such as soil moisture mapping, topography, emergence mapping alongside growth monitoring.
Show more
Together with the FarmFrites agronomic team, the growth models were validated with in-field measurements and observations. The growth model was developed based on the visual and multispectral drone flights as well as meteorological data from an online weather data platform. The growth pattern over the season has an influence on a lot of plant physiological parameters such as tuber initiation, tuber filling and the amount of intercepted energy from solar radiation which the plant uses for photosynthesis. Correct balanced nutrition is important for increasing potato tuber size. The nutrients nitrogen, phosphate, potassium, calcium, magnesium and manganese all have an effect on the potato tuber size. Normalised difference vegetation index (NDVI) imagery is one of the key inputs for Aurea’s yield model. NDVI imagery is a method of determining crop health by measuring the index of plant greenness. It is calculated on a per-pixel basis as the normalised difference between the red and near infrared bands of an image. NDVI imagery helps farmers and agronomists identify variability and anomalies in their paddocks, track growth performance and create variable rate maps. Furthermore, the availability of energy and water determines the potential plant dry mass production. A potato plant consists of above ground growth which is measured though drone imagery, and the below ground growing tubers, which is the desired yield. According to equations established in plant phenology research, a reliable yield production can thus be made.
-10%
Traceability/caliber costs
7.5
Data access user satisfaction
The model can be used halfway the season, using partly actual data partly predictive meteorology data and drone images of the start of the season only, or at the end of the season using all actual data and full season drone coverage. Ultimately, the drone data is presented on an interactive, online cloud platform for real-time prediction and monitoring. Since the data can be multiple gigabytes in size the analysis required special geographic information system (GIS) software, the cloud platform helps to lower the barrier of end-user adoption. To further improve the accuracy of the analysis the researchers are currently working on the integration of thermal data.
Get in touch with the use case team via the SmartAgriHubs Innovation Portal
Go to portalAchievements, products & services
Combination of existing models like soil and topography mapping, thermal image analysis, weather data, potato emergence rate
Standardised data exchange with the processing industry according to the current state of the art in standardisation
Traceability data from field location to storage location in the storage
Potato crop growth, yield prediction and caliber yield measurements on the harvester